The state of Ohio is an American bellwether. In politics, the path to power is a narrow one without it: President Biden is the first since Kennedy to capture the White House without winning the state. But the wisdom of “so goes Ohio, so goes the nation” extends beyond politics; the state’s capital, Columbus, has long been known as a test market that determines the national and even global fate of consumer concepts. While the state’s demographics increasingly diverge from the United States overall, it remains a potent synecdoche for America.
Geographic analogies of Chinese cities are common: Macau is China’s Las Vegas, Shanghai its New York, Shenzhen its Silicon Valley, and so on. But which province is China’s Ohio? To answer, in the demographic, but not political, sense, China Books Review constructed a similarity index based on six measures: each province’s urban ethnicity mix, age breakdown, educational attainment, and overall consumption, how that consumption is split among various categories, and the split of regional GDP among primary, secondary, and tertiary sectors. Ethnicity, age and educational data are based on the 2010 census (equivalent data from China’s 2020 census are not yet readily available) while the remaining items are sourced from the 2019 statistical yearbook, based on 2018 data.
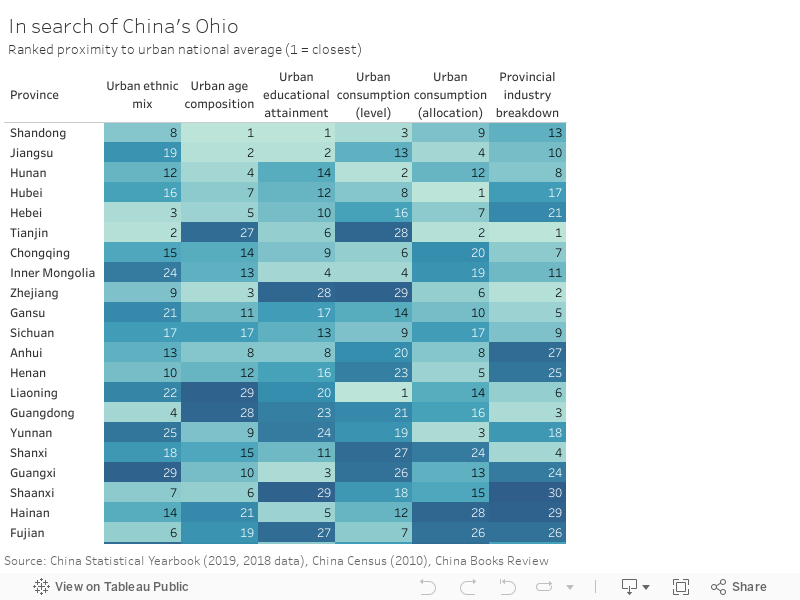
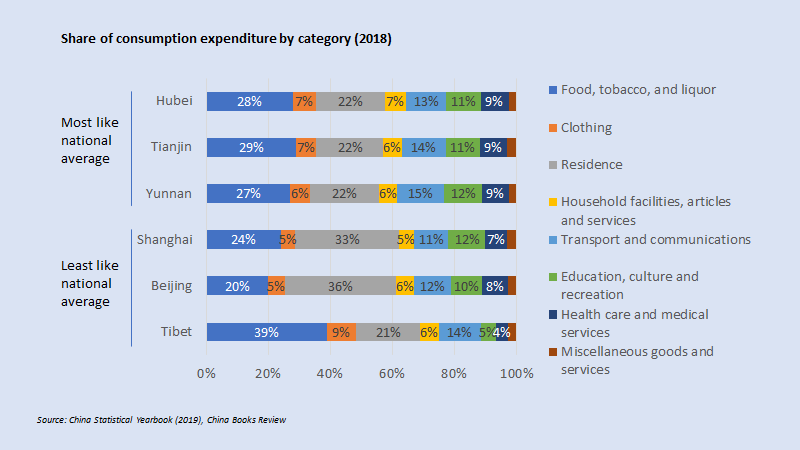
Overall, Shandong ranks closest to the national urban average, followed by Jiangsu, and Hunan. Shandong’s age composition and educational attainment most closely approximate the nation, with 46% of urban residents possessing a high school education or above. (Beijing is most educated with 61% of its residents educated at or beyond high school.) While Liaoning is closest in aggregate annual consumption at 26 thousand RMB, Hubei’s residents spend their money most similarly to the nation overall. The expenditures of Beijing and Shanghai’s population are skewed by the high cost of real estate; poorer Tibet devotes a higher share of consumption to food. Finally, Tianjin is closest to the national average in its near 60-40 split between secondary and tertiary industries.
Hunan’s high similarity rank may in part explain why its capital, Changsha, has become a fertile shopping ground for consumer-focused venture capital investment. Strikingly, according to our similarity index, Beijing trails only Tibet as least representative overall, but is closest to the national urban average in terms of ethnic mix. The provincial diversity the analysis highlights reaffirms the continued value of the Communist Party’s policy of geographic rotation. For China watchers, these findings may constitute further encouragement to spend time outside of China’s most prominent cities once China fully reopens to international travel.
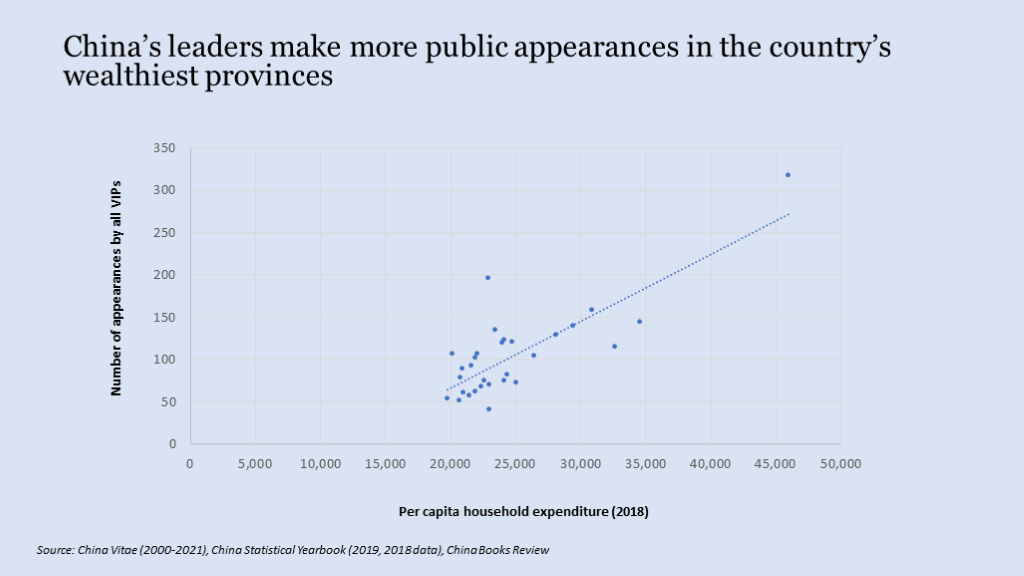
In politics, researchers Jennifer Pan and Yiqing Xu, leveraging a large-scale online survey, find that Shandong and Hubei represent the median province in terms of political liberalism. Respondents from Guangdong, Shanghai, and Beijing held the most liberal views; Xinjiang, Jiangxi, and Guizhou the least. (Respondents from Qinghai, Ningxia, and Tibet were too few to include.) An analysis by China Books Review of appearances and travel by China’s leaders, as recorded by China Vitae and excluding Beijing, suggest that they appear more frequently in the country’s wealthier provinces. Excluding Beijing, Xi Jinping since 2012 has made 50% more appearances in China’s ten wealthiest provinces than China’s least wealthy provinces.
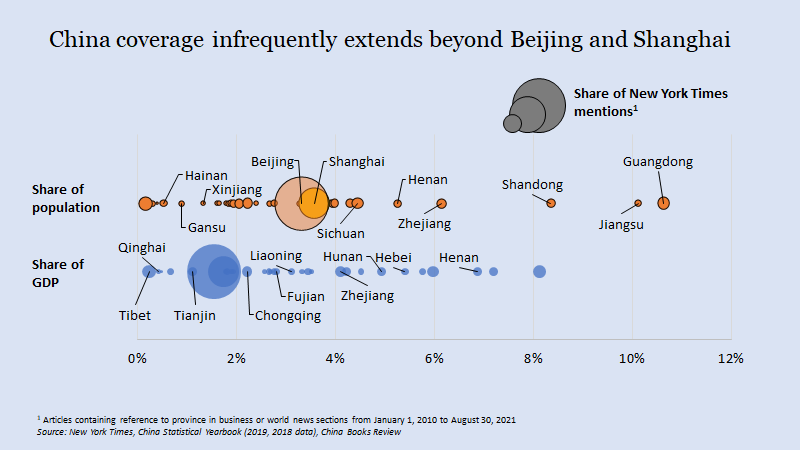
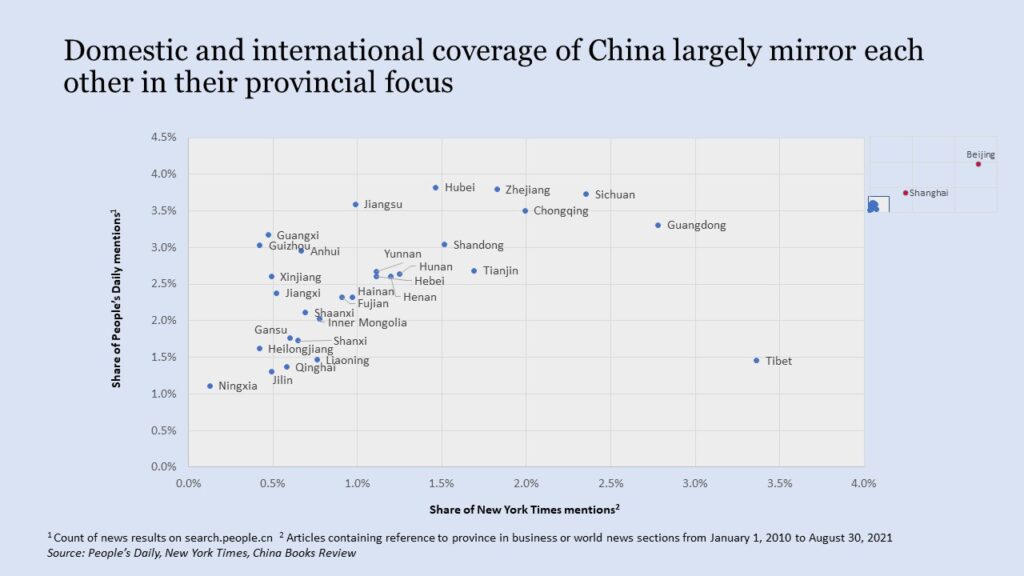
With respect to media coverage, an analysis of New York Times business and world news coverage since 2010 finds that their reporting has mentioned all of China’s provincial level regions dozens of times each, although Beijing commands half of all references. This is strikingly comparable to the relative focus of the People’s Daily coverage too. (Tibet is a notable exception, attracting greater international than domestic coverage.)
Only time will tell whether China’s Ohios will attain similar bellwether status. But, for now, they merit closer watching.